Background information

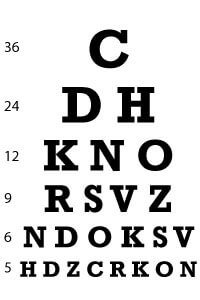
A critical role of the accessory structures of the eye (the cornea, the lens etc.) is to cause refraction of light rays to bring them to a sharp focus on the retina, so we can see clearly. This is one of the properties that underlies visual acuity. Visual acuity involves the ability of the eye to distinguish fine detail. Visual acuity is best for "central" vision (vision involving retinal positions at or around the fovea – which is why to see an object clearly, we train our eyes on to it, so that the light rays fall on the fovea). Snellen's Test Types are the most commonly used to assess acuity of distant vision. These charts present letters or symbols (called optotypes ) of decreasing sizes in numbered rows as seen below.
If seen from the distances stated for each line, each symbol subtends a visual angle of five minutes. The relevant details of the symbols (for example the gaps between the horizontal lines in an E) subtend visual angles of one minute.
Myopia (or short-sightedness) is a group of conditions leading to light focusing in front of the retina, resulting in blurred vision of distant objects – ie a decrease in visual acuity. In the following simulation you will investigate the effects of different degrees of myopia on visual acuity.
The simulation involves positioning a person at different distances from a Snellen chart. This in turn will change which rows in the Snellen chart can be seen clearly. You will first be collecting visual acuity data for a person with normal vision, followed by people with varying degrees of myopia.
Snellen chart simulation
Procedure:
- Click and drag the person to the closest position to the Snellen Chart (1m)
- Ensure that the degree of myopia is set to ‘normal eye'.
- In the table, record the number of the lowest line which is in focus.
- Move the person back one step at a time (2, 3, 4, etc.) recording the number of the lowest line which remains in focus in the table.
- Work through each degree of myopia from low to high, finding the number of the lowest in-focus row for each distance.


| Degree of Myopia | Distance to Snellen chart | |||||
|---|---|---|---|---|---|---|
| 1m | 2m | 3m | 4m | 5m | 6m | |
| Normal | ||||||
| Low | ||||||
| Medium-low | ||||||
| Medium | ||||||
| Medium-high | ||||||
| High | ||||||
Interactive explanation of the causes behind myopia and visual acuity
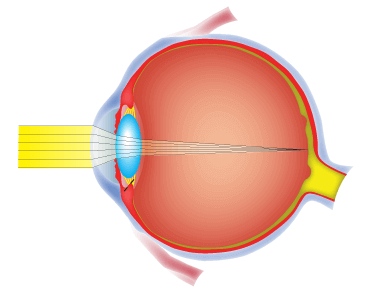
As you saw in the simulation tab, myopia can have a profound effect on visual acuity – especially at large distances. Myopia can result when the focal point of light falls before the retina, leading to a blurred image. But what causes these changes?
There are two main categories of myopia:
- Axial myopia, which is a result of lengthening of the eyeball.
- Curvature myopia, which results from a change in the refractive properties of the lens.
Choose between adjusting eye length or lens curvature and then play with the slider to increase or decrease the level of myopia. Pay special attention to where the focal point of the light is as you change the degree of myopia.


