Experimental control
Make a prediction:
Testosterone levels
Drag the pipette to extract a drop of blood from the tail of the rat. Then drop the blood in the tube and run the assay to measure the level of testosterone.
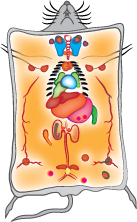

Weight of body and reproductive organs
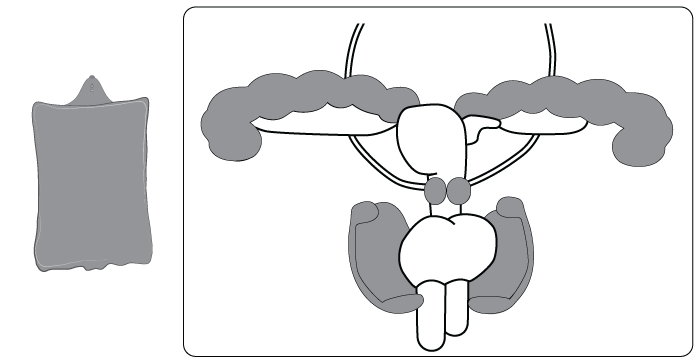
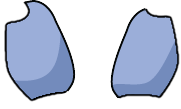
Drag the rat and the reproductive organs and drop them on the scales to get their weight. Fill the table with the data obtained.




| Organ | Weight (g) |
|---|---|
| Body | |
| Testis | |
| Epididymis | |
| Vas deferens | |
| Seminal vesicle | |
| Prostate |
| Organ | Weight (g) | |
|---|---|---|
| Control | Experiment | |
| Body | ||
| Testis | ||
| Epididymis | ||
| Vas deferens | ||
| Seminal vesicle | ||
| Prostate | ||
Histology of reproductive organs
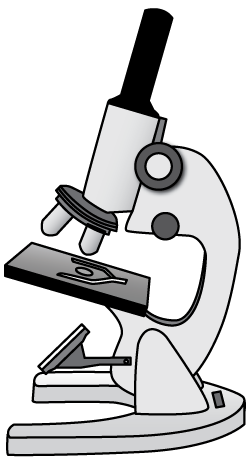
Drop the organs on the microscope to observe their histology. Observe changes between treatment groups in cell composition, structure and function.


Sperm motility
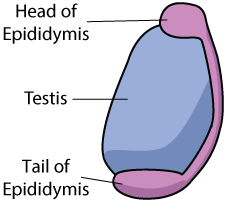
Watch the videos to evaluate sperm motility in the head and tail of the epididymis, and in the testis. Rank the motility according to the following table:
| None | Some | Most | All |
|---|---|---|---|
| 0 | 1 | 2 | 3 |
Use your observations to fill out the following table:
| Motility | |
|---|---|
| Head of epididymis | |
| Tail of epididymis | |
| Testis |
Diameter of the seminiferous tubule
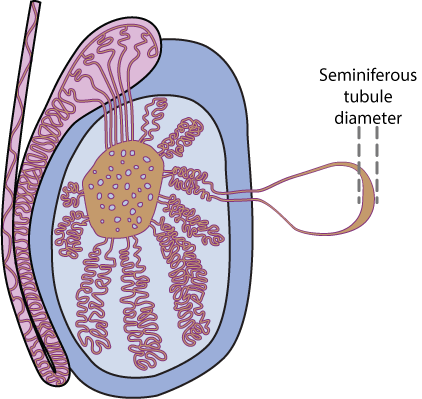
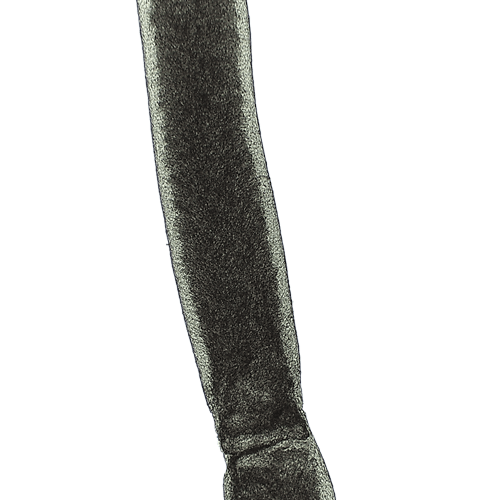
Measure the diameter of the seminiferous tubule by looking at one section through the microscope. To facilitate the measurement, we have overlaid the tubule onto a grid, whose smallest squares are 10x10 µm.

Gonadectomy
Cryptorchid
Bilateral (open-ended) vasectomy
Ethane dimethane sulphonate (EDS)
Testosterone
Estradiol
GnRH antagonist
Summary of the effect of the different treatments
This table will populate for you as you fill out the tables in the previous tabs.
| Control | Castrated | Cryptorchid | Vasectomy | EDS | T-treated | E2-treated | GnRH antagonist |
|---|
Once you have completed the summary table, links will appear to access your own results as well as a repository of data accumulated over the years. This is a completion notice that you have reached the end of the online simulation.
Please note: As a cohort, you will be generating real data during the practical class in Week 2. A class data spreadsheet will then be collated and published on Moodle for completing the associated assessment.
